
Geolocation is important, regardless of whether you are a marketer, online business owner, advertiser and so on. We need geolocation information to help us to learn more about our clients. For example, where are they coming from, what is their time zone, and many other reasons. In this article, we will guide you on how to use IP2Location filter plugin with Elasticsearch, Filebeat, Logstash, and Kibana.
To follow this tutorial, you must have a working Elastic Stack environment. For the installation of the Elastic Stack, you may get it from https://www.elastic.co/downloads.
Configure Filebeat for Log using by Logstash
- Download the suitable package for Filebeat from https://www.elastic.co/downloads/beats/filebeat and install it on your machine.
- Configure the filebeat.yml file that is located in your Filebeat root directory. Replace the content as follow:
filebeat.inputs:paths:- /path/to/log/file......output.logstash:hosts: ["localhost:5043"]filebeat.inputs: paths: - /path/to/log/file ... ... output.logstash: hosts: ["localhost:5043"]
filebeat.inputs: paths: - /path/to/log/file ... ... output.logstash: hosts: ["localhost:5043"] - For the sample data set that was used in this tutorial, you may get it from https://download.elastic.co/demos/logstash/gettingstarted/logstash-tutorial.log.gz.
- Unpack the file and make sure the paths field in the filebeat.yml is pointing correctly to the downloaded sample data set log file.
- Save the filebeat.yml file.
- Run the command below on your machine:
bin/filebeat -e -c filebeat.yml -d "publish"bin/filebeat -e -c filebeat.yml -d "publish"
bin/filebeat -e -c filebeat.yml -d "publish"
Configure Logstash to use IP2Location filter plugin
- Install the IP2Location filter plugin by:
bin/logstash-plugin install logstash-filter-ip2locationbin/logstash-plugin install logstash-filter-ip2location
bin/logstash-plugin install logstash-filter-ip2location
- Create a Logstash configuration pipeline named as test-pipeline.conf with the following contents:
input {beats {port => "5043"}}filter {grok {match => { "message" => "%{COMBINEDAPACHELOG}"}}ip2location {source => "[source][address]"}}output {elasticsearch {hosts => [ "localhost:9200" ]}}input { beats { port => "5043" } } filter { grok { match => { "message" => "%{COMBINEDAPACHELOG}"} } ip2location { source => "[source][address]" } } output { elasticsearch { hosts => [ "localhost:9200" ] } }
input {
  beats {
    port => "5043"
  }
}

filter {
  grok {
    match => { "message" => "%{COMBINEDAPACHELOG}"}
  }
  ip2location {
    source => "[source][address]"
  }
}


output {
  elasticsearch {
    hosts => [ "localhost:9200" ]
  }
}
** for more details about IP2Location filter configuration, please refer to https://www.github.com/ip2location/logstash-filter-ip2location
- Save the test-pipeline.conf file.
- Run the command below at your machine to start Logstash:
bin/logstash -f test-pipeline.conf --config.reload.automaticbin/logstash -f test-pipeline.conf --config.reload.automatic
bin/logstash -f test-pipeline.conf --config.reload.automatic
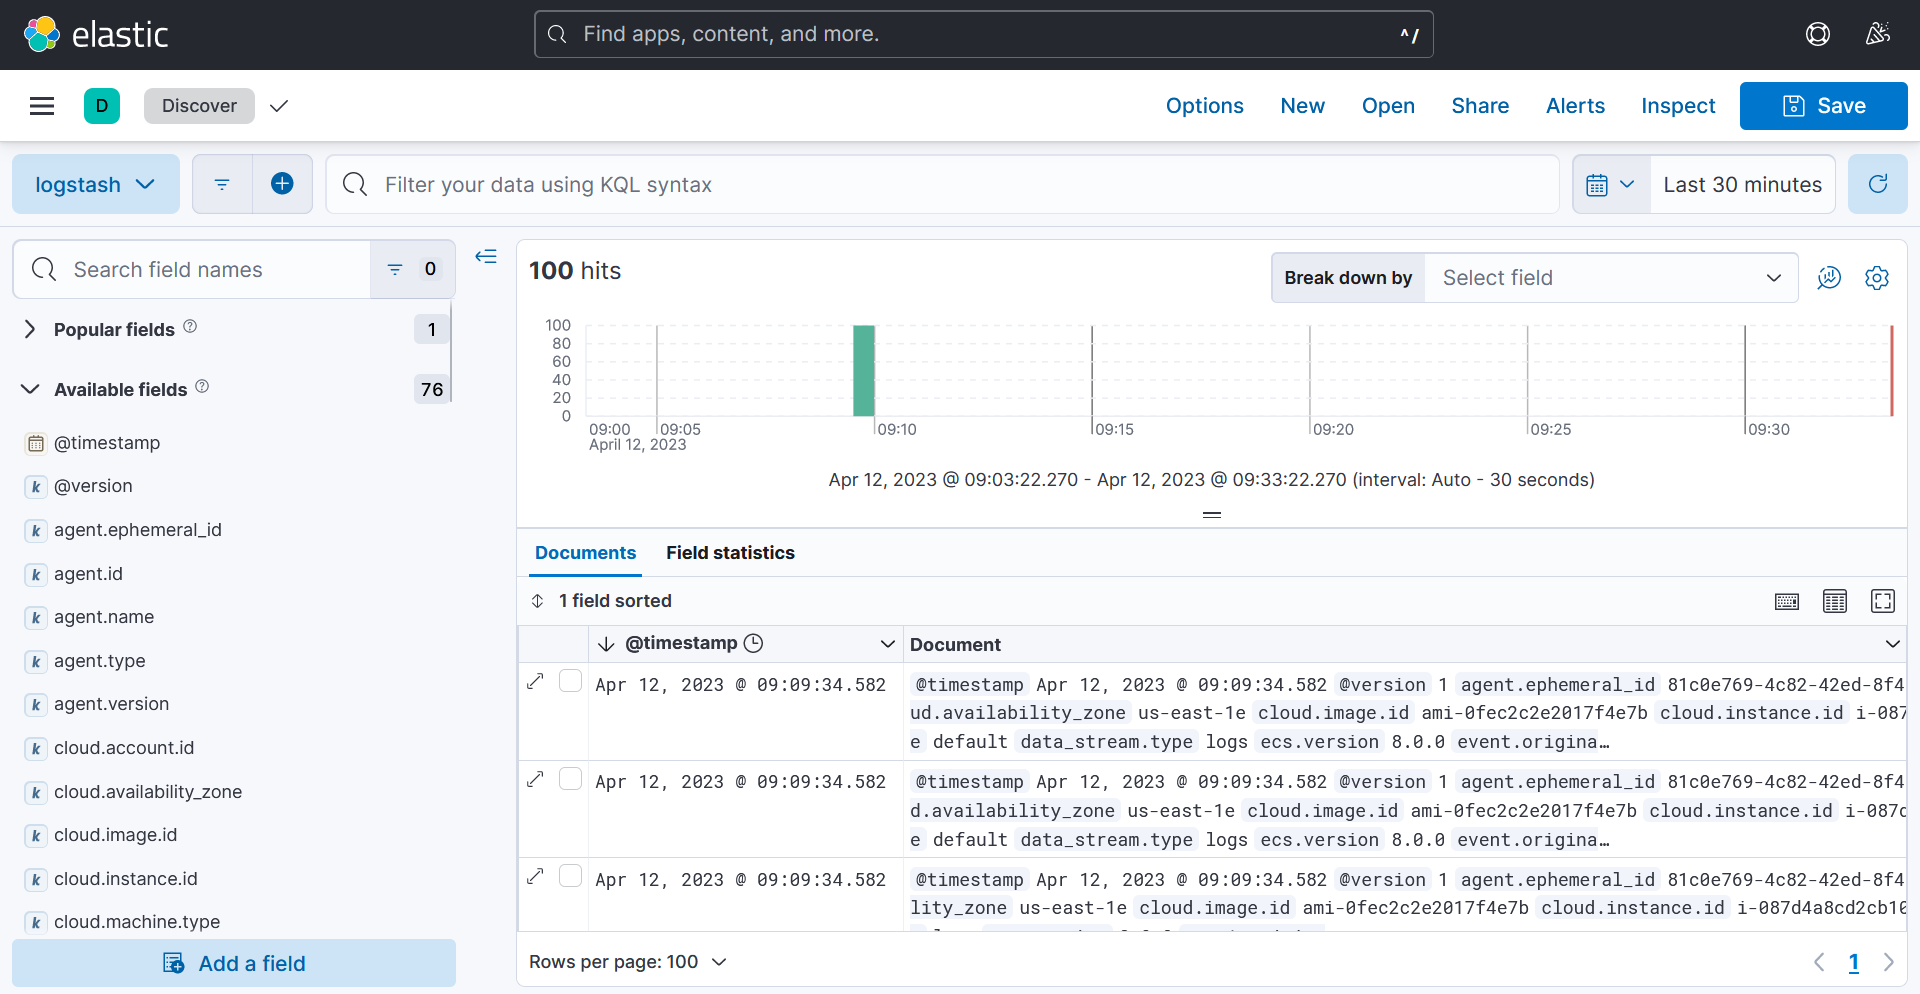
Visualize data in Kibana
After you have successfully installed Kibana on your machine, you may use Kibana to view the data by opening Kibana in a web browser.
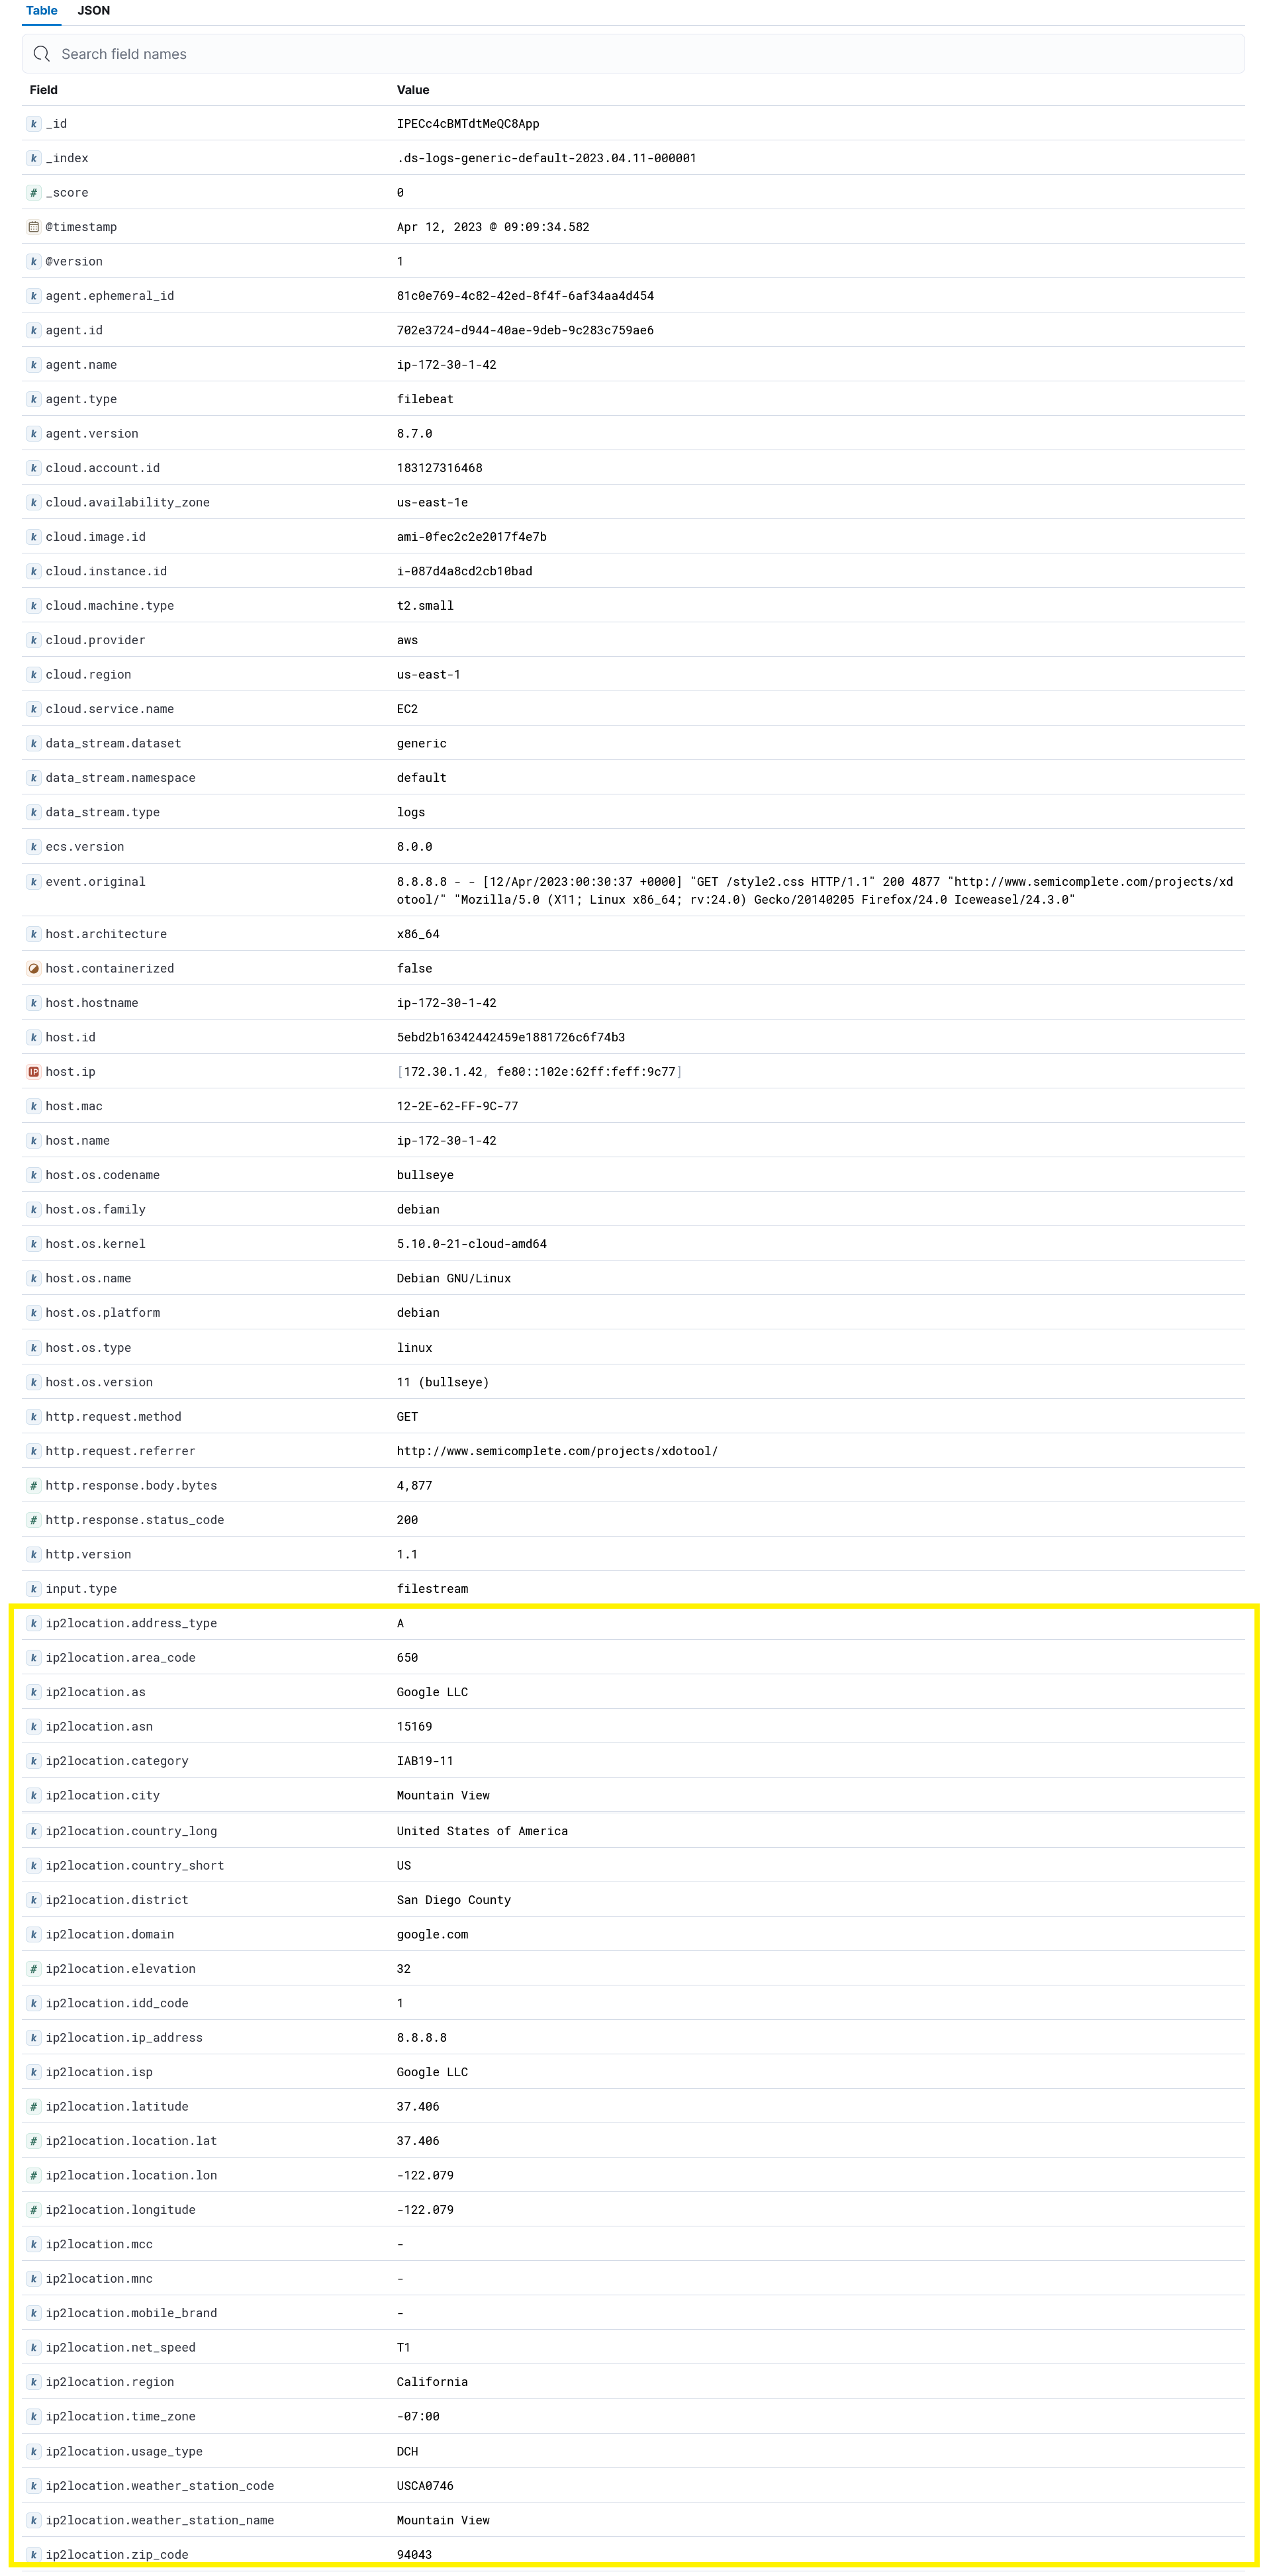
Example obtained from IP2Location filter plugin with Elastic Stack using IP2Location DB26 BIN:
- Install the IP2Location filter plugin by: